Create a graph in Excel in minutes
I came across this useful Excel video on an education blog called TILT, by Danny Maas. All New Media students (at some point in the design phase of your projects) will need to use Excel. You will need to use Excel to compile lists, crunch numbers and create graphs.
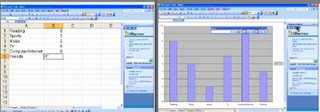
Click here to watch the video. Watch it several times. Take notes if necessary, then try to create a graph in Excel yourself. Use the survey data you collected in class and your Survey Monkey data to build the graph. The object here is to convert your text and number data into a graph.
Don't have Excel? Try Open Office!
Mr. Songhai
9/24/06
Click here to watch the video. Watch it several times. Take notes if necessary, then try to create a graph in Excel yourself. Use the survey data you collected in class and your Survey Monkey data to build the graph. The object here is to convert your text and number data into a graph.

Don't have Excel? Try Open Office!
Mr. Songhai
9/24/06
posted by H Songhai @ Sunday, September 24, 2006
![]()
![]()


0 Comments:
Post a Comment
<< Home