Keeping track of your blog
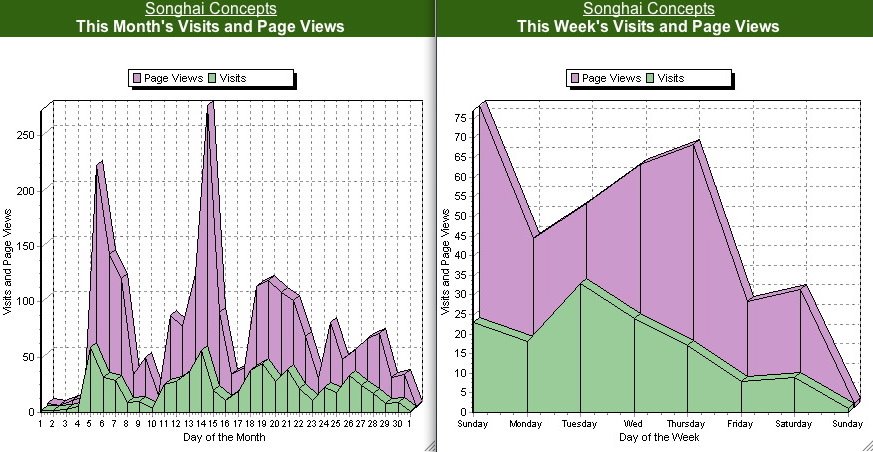
This graphic represents the number of visits made to my blog page during the month of September. The visits are colored in green and the page views are colored in purple.
Assuming that most of the visits and page views were made by New Media students, what does the graphic say about the blogging habits of New Media students for the month of September, and in particular, the last week of September? How would you explain the highs and lows represented on this graphic? Why are the page view numbers higher than the visit numbers?
Explain your answer in three or more paragraphs.
Please post your answers on your blog.
The graphics are provided Site Meter, a free web counter service.
Thanks,
Mr. Songhai
10/1/06
posted by H Songhai @ Sunday, October 01, 2006
![]()
![]()


0 Comments:
Post a Comment
<< Home